90%+ Of Bitcoin Holders In Profit After $46,000 Break: Data

[ad_1]
On-chain data shows more than 90% of Bitcoin investors are now carrying some profits following the asset’s break beyond the $46,000 mark.
Bitcoin Holders In Profit Have Crossed The 90% Mark Now
According to data from the market intelligence platform IntoTheBlock, the BTC holders in profit have climbed up following the asset’s swift move above the $46,000 level.
The indicator of interest here is the “Historical In/Out of the Money,” which shows the percentage of investors carrying some unrealized gains at any given point in the cryptocurrency’s history.
The metric works by going through the on-chain history of each address to check its transactions. If at any point a given address’ average cost basis is lower than the spot price at that point, then its holder is assumed to be in profits for that specific point in time.
The amount of investors in profits can be an important metric to watch, as holders in profits are more likely to participate in selling. If many addresses carry gains (that is, when the Historical In/Out of the Money is at high levels), a widespread selloff could become more probable.
As such, a top can form for the cryptocurrency in such periods. On the other hand, bottoms may be more likely to occur while there are only a few hands in profits, as it can suggest the selling pressure has reached a state of exhaustion.
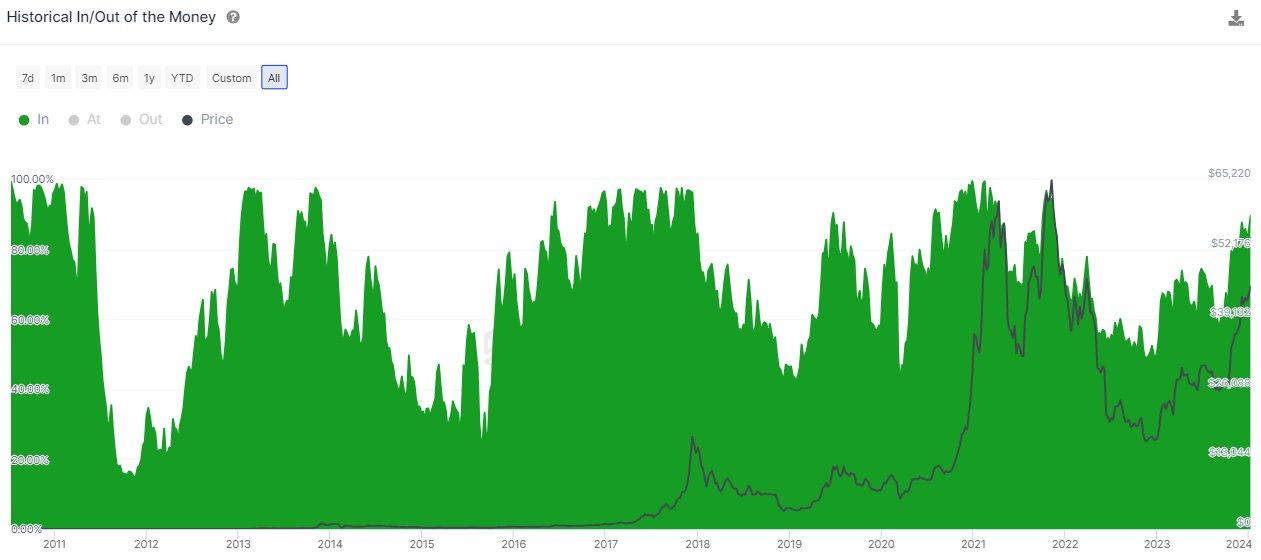
Now, here is a chart that shows the trend in the percentage of Bitcoin holders in profit over the asset’s history:
The value of the metric seems to have shot up in recent days | Source: IntoTheBlock on X
As displayed in the above graph, the percentage of Bitcoin holders in profits has shot up recently and crossed the 90% mark. This suggests that the vast majority of the market is gaining some now.
Naturally, this could suggest that the chances of a mass profit-taking event have increased. Will this lead towards the top for this rally? Perhaps past patterns could hold some answers.
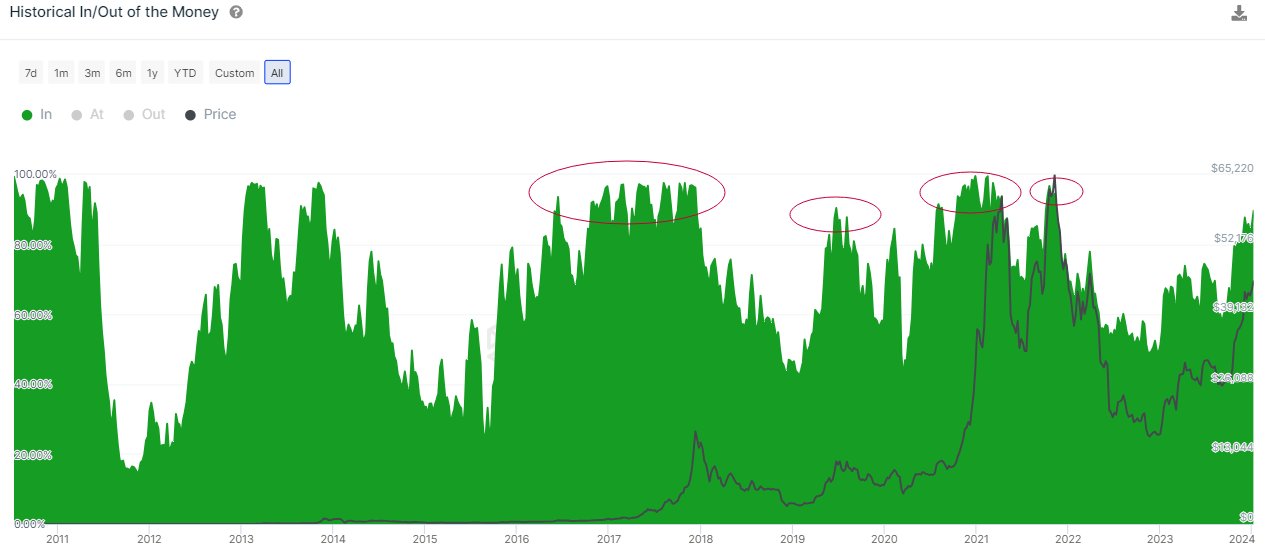
IntoTheBlock has highlighted what happened when cryptocurrency broke through this level during previous cycles.
The pattern followed during the history of the asset | Source: IntoTheBlock on X
“Historically, Bitcoin holders reached this level of profit several times in every bull cycle, including in the early stages of each cycle,” explains the analytics platform.
This means that while the cycle top has also indeed coincided with levels pushing towards 100%, the metric has always led to smaller, local tops first before this has happened. That said, it’s always difficult to say at what point of the cycle the cryptocurrency is in.
BTC Price
Bitcoin had surged past the $47,000 level earlier but has seen some pullback since then, as it’s now trading around the $46,900 mark. The below chart shows how the asset has performed during the last few days.
Looks like the value of the asset has seen a large jump over the past day | Source: BTCUSD on TradingView
Featured image from Shutterstock.com, charts from TradingView.com, IntoTheBlock.com
[ad_2]
Source link


